Mongo Dash
- Getting started
- Docs
Create powerful dashboards
in a matter of minutes.
Mongo Dash allows you to create dashboards in a just a few simple steps using MongoDB's powerful aggregation pipelines. Install the Python package and get up and running in just a few minutes.

Resizeable charts
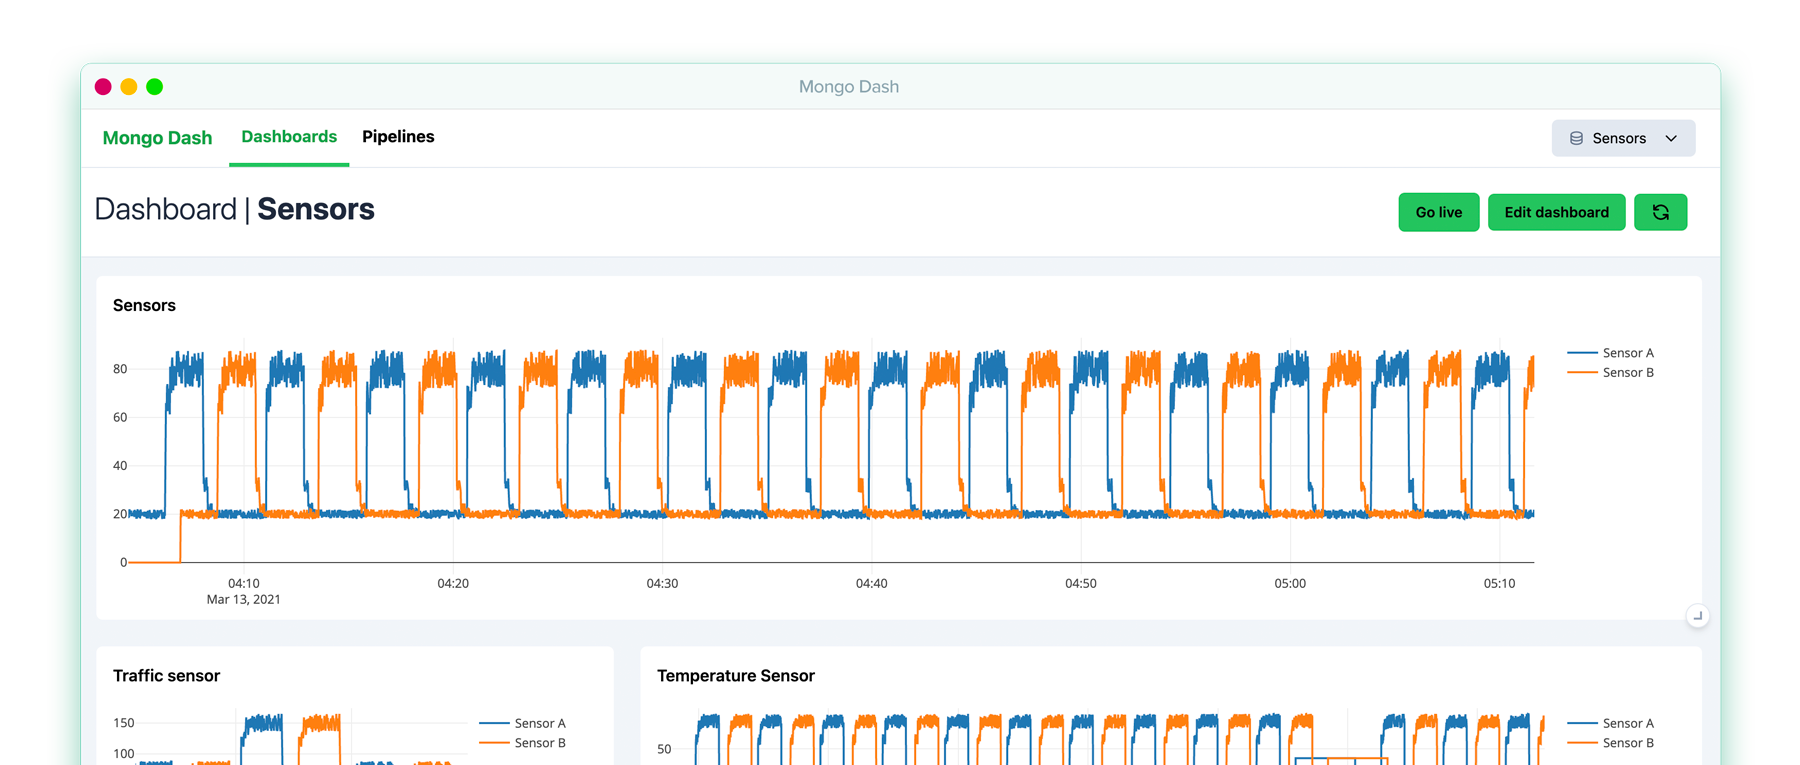
Resize your charts using the resize handle in the corner and drag them anywhere from the title. Your chart layouts are automatically saved.
See your data in real time
Press the Go Live button and see your charts update in real time.
Interactive charts
Zoom in and disable lines on your graph to get a more in depth view of your data.
Powered by MongoDB's
aggregation pipelines
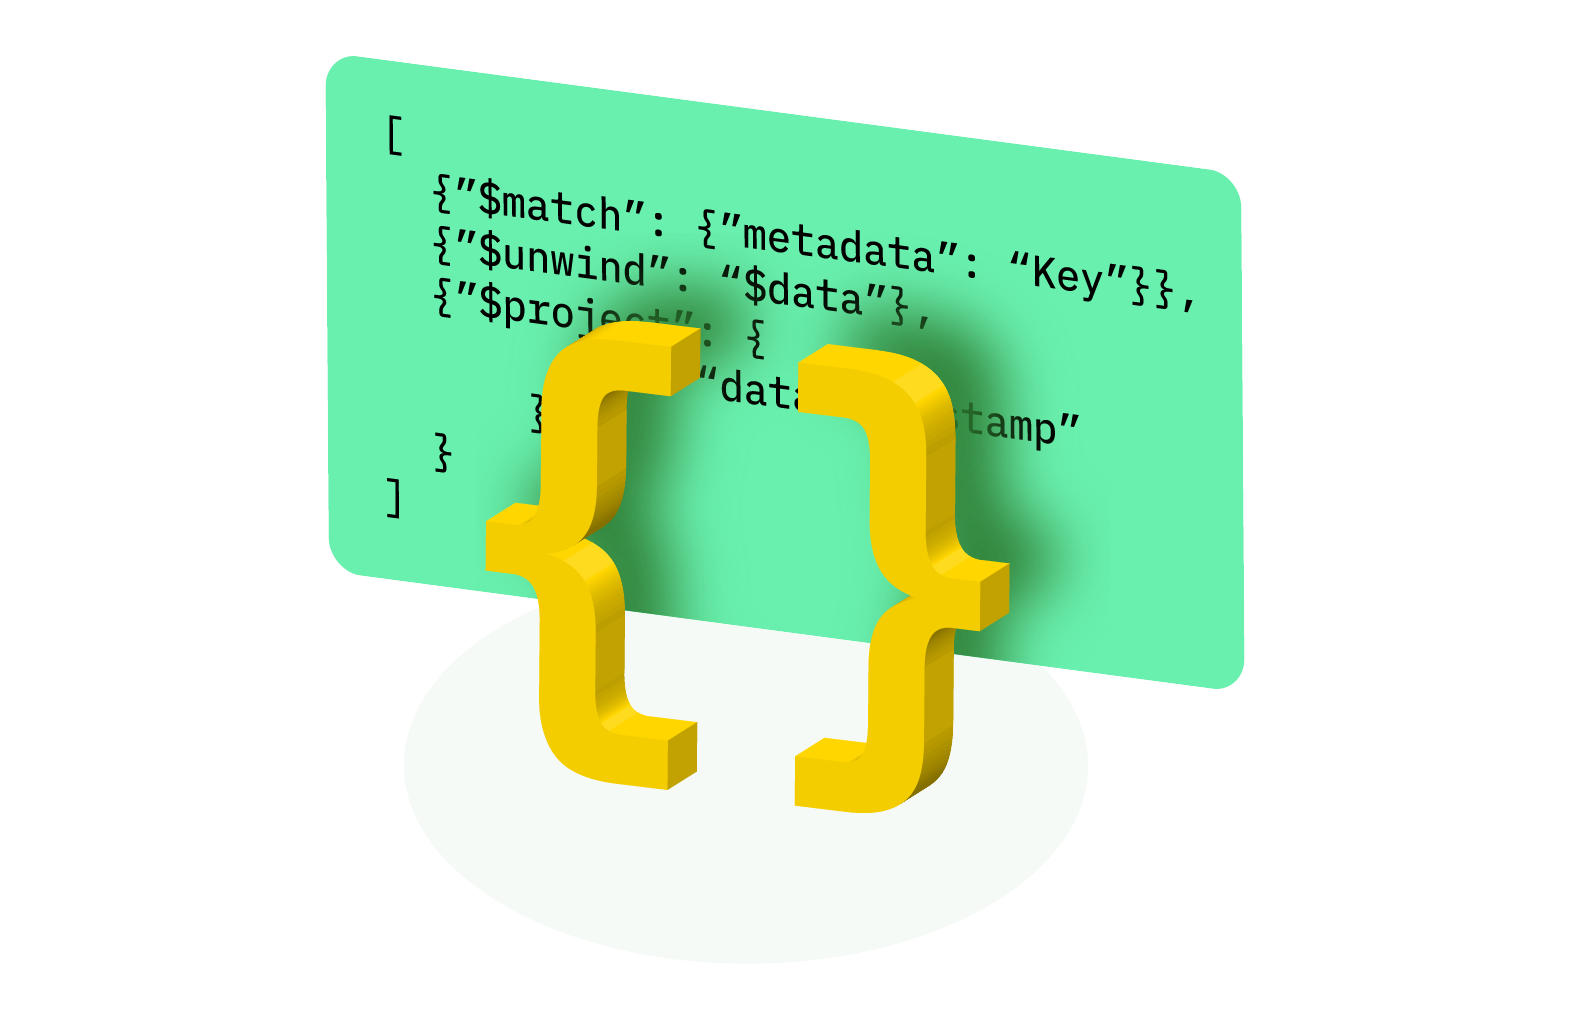
Use MongoDB's powerful aggregation pipelines to transform your data into the simple schema required for Mongo Dash.
These pipelines can be set up directly inside Mongo Dash, meaning it's compatible with any data format, whilst your data remains untouched in its original format.
